Tag: FYP

  • What Is the Difference Between an FYP, a Thesis and a Dissertation in Malaysia?

    What Is the Difference Between an FYP, a Thesis and a Dissertation in Malaysia?

    In Malaysia, a final year project (FYP) is the capstone research work of an undergraduate degree, while a thesis or dissertation belongs to postgraduate study. The real difference is not length but the originality expected: an FYP applies established methods to a new case, a master’s work engages critically with the literature, and a PhD thesis must contribute something genuinely new.

    Terminology is where most of the confusion starts, and it is worth saying plainly at the outset: Malaysian universities do not use these words identically. Your faculty handbook is the binding source, not general usage.

    What exactly is a final year project?

    An FYP is a credit-bearing course taken in the final year of a bachelor’s degree. You are assigned a supervisor, you produce a written report, and in most faculties you defend it in a presentation before a panel.

    The scale is deliberately contained. An FYP is designed to be completed alongside other coursework in one or two semesters, which is why supervisors push students towards questions that can realistically be answered in that window. In engineering and computer science faculties the FYP is frequently a build-and-test project, where the deliverable is a working system or prototype plus a report explaining the design and evaluation. In business, education and social science faculties it is more often a survey-based or case study project.

    What an FYP does not require is a new contribution to knowledge. Applying an established model to an organisation, school or community that has not been studied with it before is an entirely acceptable FYP. The novelty lives in the context, not in the theory.

    How does a master’s-level dissertation differ?

    At master’s level the expectation rises from application to critical engagement. You are no longer only showing that you can run a method correctly; you are showing that you understand why the literature disagrees, where the gaps sit, and why your study addresses one of them.

    Malaysian master’s programmes generally come in three shapes, and which one you are in determines how large the research component is:

    • By coursework. Mostly taught modules with a smaller research project or research paper at the end.
    • Mixed mode. A substantial taught component plus a dissertation of meaningful size.
    • By research. Little or no coursework; the entire degree is the research and the written thesis.

    This is precisely where the naming diverges. Some Malaysian universities call the master’s-by-research output a thesis and reserve dissertation for the shorter coursework project. Others use the two words interchangeably. A few use dissertation for the master’s work and thesis only for the doctorate, following British convention, while American convention reverses it. None of these is wrong in the abstract; only your own faculty’s usage is binding.

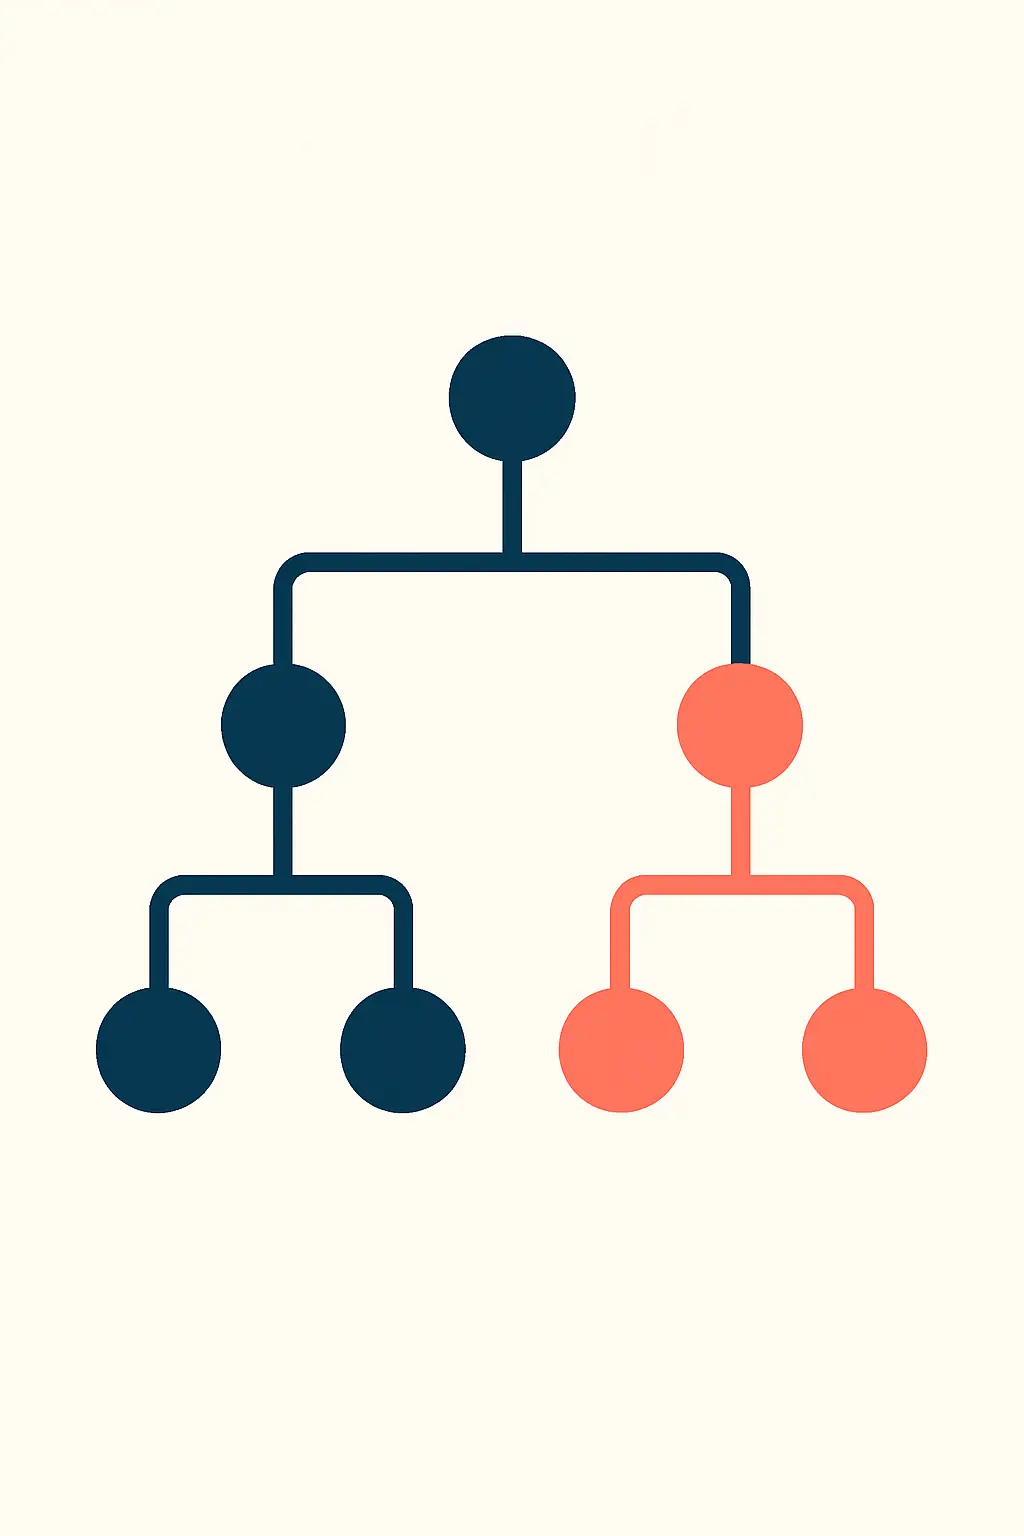
    Abstract stepped illustration representing academic levels
    What rises between the levels is the originality expected, not simply the number of pages.

    What makes a PhD thesis different?

    A doctoral thesis must make an original contribution to knowledge. That is the standard the examiners apply, and it is qualitatively different from anything asked at the two lower levels.

    In practice, original contribution can take several forms: a new theoretical model, a method applied in a way it has not been applied before, evidence that overturns or qualifies an accepted finding, or the first rigorous study of a phenomenon in a context where it matters. The examiner’s question is blunt and always the same in substance: what did the field not know before this thesis was written?

    A doctoral thesis is also examined more heavily. Most Malaysian universities require external examiners, and many require publication in indexed journals before submission or before the viva. Those publication requirements are set institution by institution, so check your graduate school’s regulations rather than relying on what a friend in another university tells you.

    How do the three compare side by side?

    Aspect Final year project Master’s dissertation or thesis PhD thesis
    Level Bachelor’s Master’s Doctorate
    Core expectation Apply established methods Engage critically with the literature Contribute original knowledge
    Typical duration One to two semesters Varies by mode of study Several years
    Examiners Internal panel Internal, sometimes external External examiners standard
    Publication expected No Sometimes encouraged Commonly required
    Literature review depth Relevant studies summarised Gap explicitly mapped Field comprehensively positioned

    Is there a required word count?

    There is no national word count for any of the three. Each university, and often each faculty within it, sets its own limits in its thesis or FYP guidelines. Two students at different Malaysian universities can produce equally strong master’s work at noticeably different lengths.

    Treat length as a constraint to check, not a target to chase. Examiners assess the strength of the argument and the fit between the research question and the method. A tight, focused thesis regularly scores better than a padded one, and padding is easy to spot: repeated literature, over-long method descriptions and results tables reproduced twice in different forms.

    Does the viva work the same way at each level?

    No, and the differences matter for how you prepare.

    For an FYP, the defence is usually a presentation to a small internal panel, focused on whether you understand what you did and can justify your choices. For a master’s, the examination is more searching about method and the positioning of your work relative to prior studies. For a doctorate, the viva is a sustained examination of the contribution itself, typically involving examiners from outside the university, and in many Malaysian institutions it runs in stages, with a closed examination before any public presentation.

    What every level shares is that examiners ask why you made your methodological choices. That question is unavoidable, and preparing an answer for it is the single highest-value hour of viva preparation at any level.

    Which term should you use in your own writing?

    Use whatever your faculty handbook uses, consistently, from the title page onward. If the handbook says dissertation, do not write thesis in your abstract because it sounds weightier. Naming inconsistencies on the cover page are an entirely avoidable reason for a document to be returned, and they are noticed immediately.

    If your handbook is genuinely silent or ambiguous, ask your supervisor once, in writing, and then follow that answer everywhere.

    How do the research decisions differ in practice?

    The practical decisions you face are actually similar at all three levels: choosing a design, selecting participants or data, picking an analysis, and writing it all up defensibly. What changes is how much justification each decision demands.

    At FYP level you explain why your method suits your research question. At master’s level you compare alternatives and explain why the others were less suitable. At doctoral level the methodological choice may itself form part of the contribution.

    If you are at the point of choosing an analysis, the decision guide on which statistical test to use for your FYP data walks through the choice by data type and research question. When you are ready to write the chapter itself, see how to write the methodology chapter of a Malaysian FYP or thesis.

    Writing at the level your examiners expect

    Understanding which level you are writing at tells you how deep the argument has to go. The harder part is turning that understanding into chapters that actually read as a coherent argument rather than a sequence of sections.

    Tesify helps you build and develop each part of the document in order, from outline through to full chapters, with you remaining the author and responsible for the content. More than 9,000 students have used it to produce over 15,000 chapters, and 100% of the writing stays yours.

    Start building your chapter outline in Tesify

    Frequently asked questions

    Is a thesis always longer than a dissertation?

    Not necessarily, and the assumption causes real confusion because the two words are used in opposite ways in British and American convention. Length depends on the level, the discipline and your faculty’s own limits, not on which of the two words your university happens to use.

    Can I turn my FYP into a master’s dissertation later?

    You can build on it, and doing so is often sensible because you already know the literature. What you cannot do is resubmit the same work. A master’s project must raise the level: new variables, a different theoretical frame, a wider population, or a context that differs in a theoretically meaningful way.

    Do I need to publish from my FYP?

    No. Publication is not normally expected at undergraduate level. Some students do publish with their supervisor, and it is a genuine advantage if you plan to continue to postgraduate study, but it is not a requirement.

    Does an FYP have to be quantitative?

    No. Both qualitative and quantitative designs are accepted across Malaysian faculties. What matters is that the design answers your research question. A qualitative FYP with a well-justified sampling strategy is as legitimate as a survey-based one.

    How many references does each level need?

    No national minimum exists. Some faculties set expectations in their guidelines; many do not. The workable standard is that every substantive claim you make should be supported, and that the balance shifts towards journal articles as the level rises.

    What happens if I fail my viva?

    Outcomes vary by institution but outright failure is uncommon. The usual results are corrections, ranging from minor edits to substantial revision and resubmission within a set period. Your graduate school’s regulations set out the exact categories and timelines, and it is worth reading them before the viva rather than after.

    Is ethics approval needed for an FYP?

    It depends on what you are doing. Research involving human participants, personal data, or clinical settings normally requires review, and many Malaysian universities extend this requirement to undergraduate projects. Ask early, because approval can take weeks and it cannot be obtained retrospectively.

    Can a group complete a final year project together?

    Some faculties allow group FYPs, particularly for engineering and system-building projects, while others require individual work. Where group work is permitted, the assessment usually identifies each member’s individual contribution, so agree on the division of work early and document it.

    Does a master’s by coursework still involve research?

    Yes, almost always, but on a smaller scale than a research-mode degree. The research component may be called a project paper, research report or dissertation depending on the university. Check how many credits it carries, because that tells you more about the expected scope than the name does.

    Where can I read completed examples from my own faculty?

    Most Malaysian universities maintain an institutional repository holding past theses and dissertations. Reading two or three from your own department is the fastest way to understand the formatting conventions and the depth actually expected where you study, which no general guide can tell you precisely.

  • Which Statistical Test Should I Use for My FYP Data?

    Which Statistical Test Should I Use for My FYP Data?

    Three questions decide your statistical test: what your research question is asking, what type of data your dependent variable is, and how many groups you are comparing. Answer those three in order and the choice narrows to one or two tests. Choosing the test first and forcing the question to fit is the error that sends most methodology chapters back for revision.

    This guide works through those three questions and gives you a decision table you can check your own study against.

    Question 1: What is your research question actually asking?

    Statistical tests answer four broad kinds of question, and almost every FYP falls into one of them:

    • Is there a difference between groups? Do male and female students differ in academic stress? Did the intervention group outperform the control group?
    • Is there a relationship between variables? Does study time relate to results? Does service quality relate to satisfaction?
    • Does one thing predict another? Do compensation and work environment predict employee performance?
    • Is there an association between categories? Is faculty membership associated with preferred learning mode?

    Write your research question out and underline the verb. Words like differ, compare and effect of an intervention point to difference tests. Words like relationship, association and correlate point to correlation. Words like predict, influence and determine point to regression.

    Question 2: What type of data is your dependent variable?

    This is the question students most often get wrong, and it controls everything downstream.

    • Nominal. Unordered categories: faculty, gender, employment status, yes or no answers.
    • Ordinal. Ordered categories without equal intervals: ranking, satisfaction levels, a single Likert item.
    • Interval or ratio (continuous). Numbers where the distance between values is meaningful: age, income, test score, or a summed scale score.

    One point causes endless confusion in FYP work: a single Likert item is ordinal, but a summed or averaged scale built from several Likert items measuring the same construct is routinely treated as continuous in the social sciences. That is why studies using validated multi-item instruments can legitimately run correlation and regression on scale scores. If you are analysing one item on its own, treat it as ordinal.

    Question 3: How many groups or variables are involved?

    For difference questions, count the groups and note whether they contain the same people:

    • Two independent groups. Different people in each, for example male and female students.
    • Two related measurements. The same people measured twice, for example before and after training.
    • Three or more independent groups. For example students from four faculties.

    For prediction questions, count your independent variables: one means simple regression, more than one means multiple regression.

    Laptop screen showing statistical output beside printed survey forms
    Answer the three questions before opening your software, not after.

    The decision table

    Your question Dependent variable Groups or predictors Usual test Non-parametric alternative
    Difference Continuous 2 independent groups Independent samples t-test Mann-Whitney U
    Difference Continuous 2 related measurements Paired samples t-test Wilcoxon signed-rank
    Difference Continuous 3+ independent groups One-way ANOVA Kruskal-Wallis
    Difference Continuous 3+ related measurements Repeated measures ANOVA Friedman
    Association Nominal 2 categorical variables Chi-square test of independence Fisher’s exact test for small counts
    Relationship Continuous 2 continuous variables Pearson correlation Spearman correlation
    Prediction Continuous 1 predictor Simple linear regression
    Prediction Continuous 2+ predictors Multiple linear regression
    Prediction Binary outcome 1 or more predictors Binary logistic regression

    When do you need the non-parametric alternative?

    The tests in the fourth column assume, among other things, that your continuous outcome is reasonably normally distributed within groups. When that assumption fails badly, you move to the alternative in the fifth column, which works on ranks instead of raw values.

    You would typically switch when a normality test on your data indicates a clear departure from normality, when your sample is small, or when your dependent variable is genuinely ordinal rather than continuous. The trade-off is real: non-parametric tests are more robust but generally have less power to detect an effect that exists.

    Two cautions worth knowing. First, normality tests become very sensitive in large samples and can flag trivial departures, so inspect a histogram rather than relying on the test alone. Second, the assumption concerns the distribution within groups, not the shape of your whole dataset lumped together.

    What else must you check before reporting?

    1. Independence of observations. Each participant contributes one response, unless you are deliberately using a paired or repeated-measures design.
    2. Homogeneity of variance for t-tests and ANOVA. Most software reports this alongside the test, and there are corrected versions to use when it fails.
    3. Linearity for correlation and regression. A scatterplot answers this in seconds and can reveal a strong curved relationship that a correlation coefficient would report as near zero.
    4. Multicollinearity for multiple regression. Predictors that are too highly correlated with each other make individual coefficients unstable and hard to interpret.
    5. Expected cell counts for chi-square. When expected counts fall too low, the test becomes unreliable and Fisher’s exact test is the usual remedy.

    Report these checks in your results chapter. Examiners look for them, and a study that reports a failed assumption and explains how it was handled reads as more competent than one that quietly ignores it.

    Two worked examples

    Example 1. “Is there a significant difference in academic stress between first-year and final-year students?” The question asks about difference. The dependent variable is a summed stress scale, so continuous. There are two independent groups. That gives an independent samples t-test, or Mann-Whitney U if the stress scores are badly skewed.

    Example 2. “Do service quality and price fairness influence customer loyalty?” The verb is influence, so this is prediction. The outcome is a continuous loyalty scale. There are two predictors. That gives multiple linear regression, with linearity and multicollinearity checked before the results are interpreted.

    The mistake that causes most revisions

    Running a test that does not match the research question. A study whose research question asks whether a relationship exists, but whose analysis chapter reports group comparisons, will be sent back regardless of how correctly the arithmetic was done.

    The fix is a single sentence in your methodology chapter that connects the two explicitly: “Because research question two asks whether service quality predicts customer loyalty, multiple linear regression was used, with loyalty as the dependent variable and service quality and price fairness as predictors.” That sentence tells the examiner you chose deliberately rather than by habit.

    Does the level of your degree change the test?

    No. The same tests are available at every level, and a well-executed t-test at doctoral level is not a weakness if it answers the question. What rises with the level is how thoroughly you justify the choice and how carefully you discuss its limitations. The differences between the levels are set out in the comparison of FYP, thesis and dissertation in Malaysia.

    Once the test is settled, it needs to be written into your methodology chapter alongside your design, population and instrument. The guide on how to write the methodology chapter covers that structure step by step.

    Writing up your analysis so it reads as a decision

    Choosing correctly is half the work. The other half is writing the analysis so a reader can follow why each step happened, from assumption checks through to interpretation, without the chapter contradicting itself.

    Tesify helps you draft and structure the methodology and results chapters so that the test you chose, the assumptions you checked, and the way you report the outcome stay consistent throughout. Tesify does not run your statistics; you do that in your own software and remain responsible for every number.

    Draft your methodology and results chapters in Tesify

    Frequently asked questions

    Can I use a t-test for three groups by running it three times?

    You should not. Running repeated pairwise tests inflates the chance of finding a significant difference by chance. Use one-way ANOVA for three or more groups, then a post-hoc test to identify which specific pairs differ.

    What is the difference between correlation and regression?

    Correlation measures the strength and direction of a relationship without assigning direction of influence. Regression models one variable as an outcome predicted by others and gives you an equation. If your hypothesis says one thing affects another, regression matches it better.

    Can I treat Likert data as continuous?

    A summed or averaged multi-item scale is commonly treated as continuous in social science research. A single Likert item is ordinal. State plainly in your methodology chapter which you are doing and cite the convention you are following.

    How do I know whether my data is normally distributed?

    Combine evidence rather than relying on one signal: inspect a histogram, look at skewness and kurtosis values, and run a normality test. In larger samples the formal test can flag departures too small to matter, so the visual check carries real weight.

    What if my results are not significant?

    Report them exactly as they are and discuss why. A non-significant result is a legitimate finding. What will damage you in the viva is being unable to explain it, or worse, adjusting data to produce significance, which is a serious breach of academic integrity.

    Do I need to report effect size?

    It is increasingly expected and always strengthens your discussion. Significance tells you whether an effect is likely to be real; effect size tells you whether it is large enough to matter practically. Most software reports it, sometimes only when you enable the option.

    Which software should I use?

    Use whatever your university licenses and your supervisor recognises. All mainstream statistical packages produce identical results for these standard tests because the underlying formulas are the same. Familiarity matters more than features when a deadline is close.

    My sample is only 30 respondents. Which tests can I use?

    Standard tests still run, but they have limited power to detect effects, and normality assumptions matter more at small sample sizes. Non-parametric alternatives are often the safer choice. State the sample size as a limitation and avoid overstating what your results establish.

    Can I use chi-square with continuous data?

    Not directly. Chi-square works on frequency counts in categories. Some students convert continuous data into categories to force it, which throws away information and is generally discouraged. Use a test suited to continuous data instead.

    What is the difference between one-tailed and two-tailed tests?

    A two-tailed test looks for a difference in either direction; a one-tailed test looks in a specified direction only. Use one-tailed only when theory genuinely justifies predicting the direction in advance, and state that justification. Two-tailed is the safer default and the usual expectation.

  • How to Write the Methodology Chapter of a Malaysian FYP or Thesis

    How to Write the Methodology Chapter of a Malaysian FYP or Thesis

    The methodology chapter explains what you did and why it was the right thing to do, in enough detail that another researcher could repeat it. Work through the eight steps below in order. The single thing examiners test hardest is internal consistency: every component must follow from your research questions and agree with every other component.

    Before you start, open your faculty’s FYP or thesis guidelines. Malaysian universities differ on required subsections and headings, and the handbook overrides any general advice, including this article.

    Step 1: Restate the research questions at the top

    Begin the chapter by repeating your research questions verbatim from Chapter 1. This is not filler. It anchors everything that follows and lets you check each later decision against the question it serves.

    If you find yourself unable to connect a section of this chapter back to one of those questions, that section does not belong.

    Expected output: the questions restated word for word, unchanged from Chapter 1.

    Step 2: State the research design and justify it

    Name your approach and your specific design, then explain why it fits. Naming alone is not enough; the justification is what earns the marks.

    Model sentence you can adapt:

    “This study adopts a quantitative approach using a cross-sectional survey design. This design was selected because the research questions require measuring the strength of the relationship between service quality and customer loyalty across a defined population at a single point in time. A qualitative design was not adopted because the objective is to test hypotheses derived from existing theory rather than to explore meaning.”

    Note the final sentence. Explaining why the alternative was not chosen is the element most FYP chapters omit, and adding it changes how the choice reads: as a methodological decision rather than a default.

    Step 3: Define the population and the sampling

    Population and sample are different things and must be written separately.

    1. Define the population precisely: who, where, and during what period. “Employees of manufacturing firms in Selangor” is too loose. “Full-time production staff at [Company] in 2026, totalling 320 people” is defensible.
    2. State where the population figure came from, including the source and its date. An unsourced population number is a standing invitation for a viva question.
    3. State your sample size and how it was determined, showing the calculation rather than only the result.
    4. Name the sampling technique and make sure it is consistent with the sample size method you used.

    That last point is where chapters quietly contradict themselves. A sample size formula that assumes random selection sits badly beside a procedure describing whoever happened to be available. If circumstances force convenience sampling, say so plainly and record it as a limitation.

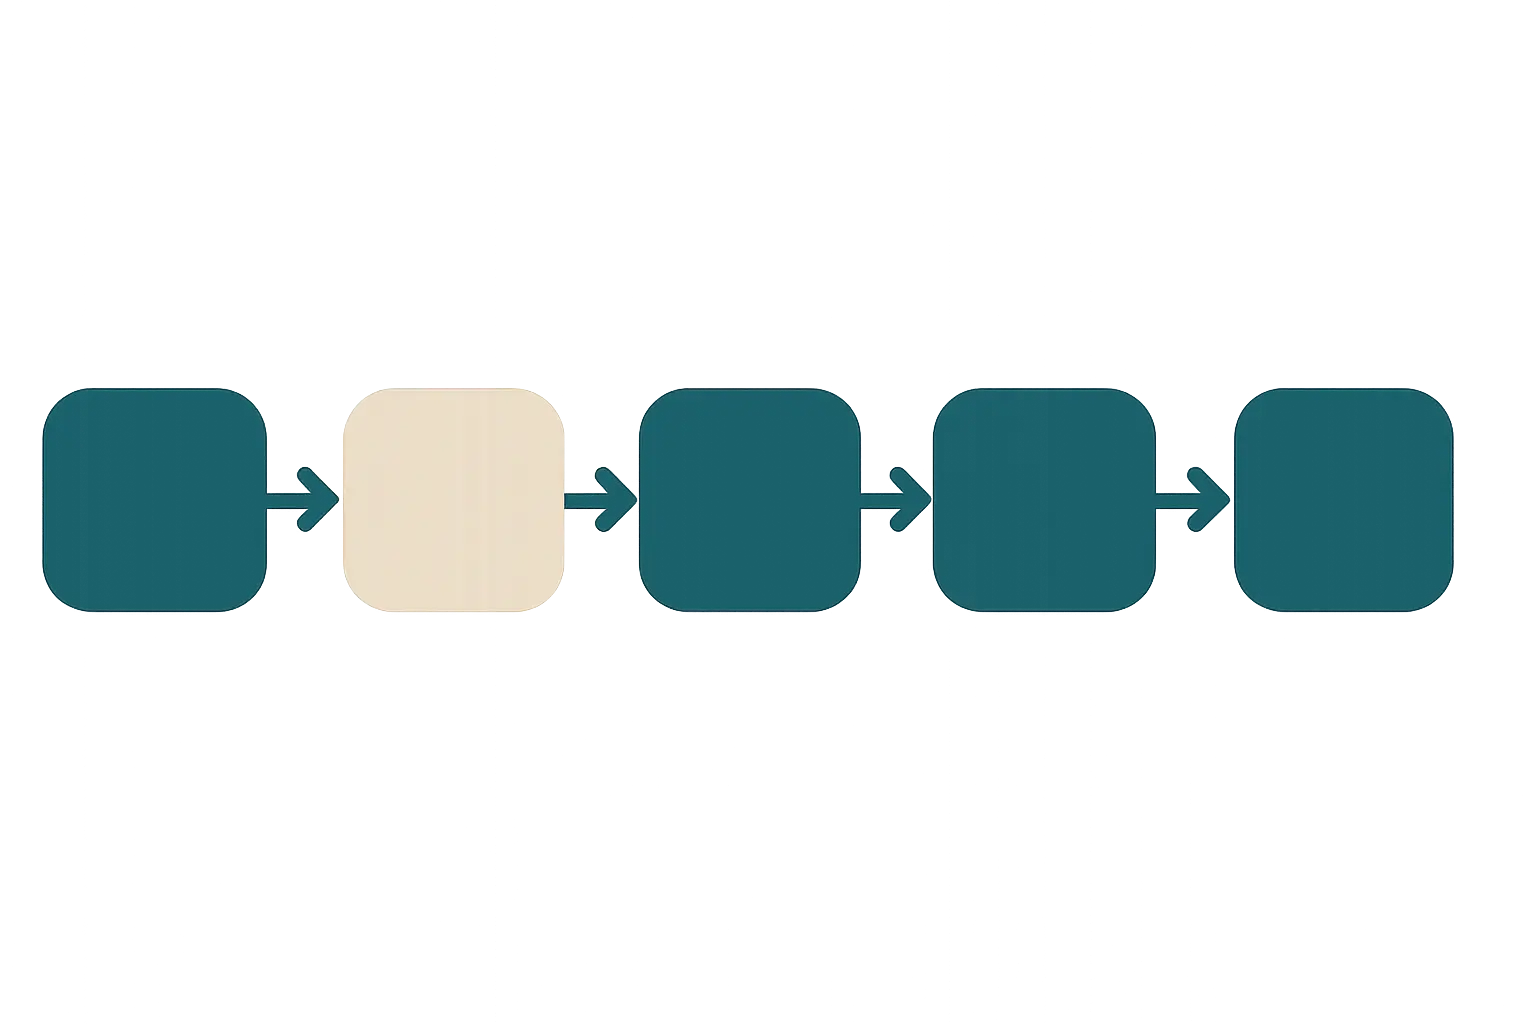
    Flow diagram representing stages of a research design
    Each stage must follow from the research questions and agree with every other stage.

    Step 4: Describe the instrument

    Explain exactly how each variable was measured. For a questionnaire study, cover:

    1. The structure, section by section, and what each section measures.
    2. The source of each set of items, whether adapted from a published instrument or newly developed.
    3. The response scale used for each construct.
    4. Any modifications you made to adapted items, and why.

    If you adapted a published instrument, cite it properly and state what you changed. Adapted items must be re-tested for validity and reliability, because results reported for the original version do not automatically transfer to your modified version or to a different population.

    For a build-and-test project, this section describes the development method, the tools used, and the criteria against which the system will be evaluated.

    Step 5: Set out the data collection procedure

    Write this as a chronological sequence a reader could follow, including approvals.

    1. Ethics or institutional approval, with the process named.
    2. Permission obtained from the organisation, school or clinic involved.
    3. Pilot test, including how many respondents took part and what changed as a result.
    4. Main data collection: how the instrument was distributed, over what period, and how responses were returned.
    5. Response rate: how many were distributed, how many returned, and how many were usable.

    Start the approval process early. Research involving human participants, personal data or clinical settings typically needs review at Malaysian universities, approval cannot be granted retrospectively, and waiting for it is one of the most common causes of a delayed FYP.

    Step 6: State the data analysis plan

    Say which analysis answers which research question. Mapping them explicitly is the fastest way to demonstrate that the chapter holds together.

    Model sentence:

    “Research question one is answered using descriptive statistics reporting means and standard deviations for each construct. Research question two is answered using multiple linear regression, with customer loyalty as the dependent variable and service quality and price fairness as predictors. Assumption testing for normality, linearity and multicollinearity was conducted before interpreting the regression output.”

    If you are unsure which test matches your question, work through the decision guide on which statistical test to use for your FYP data before writing this section. Deciding here rather than after data collection saves a rewrite.

    Step 7: Address validity and reliability

    For quantitative work, report the pilot results for each construct and state the criteria you applied. Run item validity first, remove items that fail, then recompute reliability on the retained items. Computing reliability while keeping items you have already declared invalid is a frequent and easily spotted error.

    For qualitative work the equivalent section addresses trustworthiness, and you should name the specific strategies you used, such as triangulation across data sources, member checking with participants, an audit trail of decisions, or peer debriefing. Naming the strategies is not enough on its own; describe how each was actually carried out in your study.

    Step 8: State the limitations honestly

    Every design has limits. Naming them yourself is a strength, because the alternative is an examiner naming them for you while you appear not to have noticed.

    Useful limitations to consider: a sample drawn from a single organisation restricting generalisability, a cross-sectional design preventing causal claims, self-reported data carrying response bias, and a response rate below the calculated target.

    Write each as a specific consequence rather than a vague apology. “Because data were collected from one company, the findings may not generalise to other firms in the sector” is useful. “There were some limitations in this study” is not.

    The consistency check before you submit the chapter

    Read the chapter once with a single question in mind: does every element follow from the research questions and agree with every other element? Specifically check that:

    • The design matches the verbs in your research questions.
    • The sampling technique matches the sample size method.
    • The instrument measures every variable named in your framework, and nothing extra.
    • The analysis plan covers every research question, with none left unanswered.
    • The number of questionnaire items is compatible with the analysis you intend to run.

    Most returned methodology chapters fail on one of these five, not on the quality of the writing. The depth of justification expected does rise with the level of your degree, as set out in the comparison of FYP, thesis and dissertation in Malaysia.

    Writing a chapter that holds together

    Methodology is the most structured chapter in the document, which is exactly why inconsistencies stand out so clearly. Most students know what they did; the difficulty is setting it down in an order where each part visibly follows from the last.

    Tesify helps you build the chapter section by section, keeping design, population, instrument and analysis aligned as you draft, with you remaining the author and responsible for every methodological decision. More than 9,000 students have used it to produce over 15,000 chapters.

    Build your methodology chapter in Tesify

    Frequently asked questions

    How long should the methodology chapter be?

    There is no national standard, and faculties differ. Completeness matters more than length: every component present, every choice justified, and enough detail that another researcher could replicate the study. Check your handbook for any stated limit.

    Should the chapter be written in past or present tense?

    Write the proposal version in future or present tense, then convert to past tense once the work is done, because you are reporting what you actually did. Many faculties specify this, so check the handbook, and above all be consistent throughout.

    Do I need a research philosophy section?

    Some faculties require a short statement of philosophical position, others consider it unnecessary at undergraduate level. Follow your handbook. Where it is required, keep it brief and connect it to your design rather than reproducing textbook definitions.

    How many respondents should the pilot test have?

    A commonly used working figure in Malaysian faculties is around 30 respondents with characteristics similar to your sample but excluded from the main study. This is convention rather than a national rule, so confirm against your own guidelines.

    Can I write the methodology chapter before collecting data?

    Yes, and you should. It is your plan of work, so most of it can be drafted before data collection begins. That is why it is the most efficient chapter to write early while waiting for approvals or supervisor feedback on other sections.

    What if my actual procedure differed from the plan?

    Report what actually happened, not the plan. If the response rate fell short or the timeline shifted, describe the reality and discuss the consequences in your limitations. Examiners handle honest deviation routinely; a chapter that describes a procedure the data could not have come from is a far worse problem.

    Do qualitative studies need a sample size calculation?

    No. Qualitative sampling is governed by data saturation, the point at which further interviews stop producing new themes, together with clear selection criteria for participants. Explain both rather than presenting a formula.

    Should I include the questionnaire in this chapter?

    Describe its structure in the chapter and place the full instrument in an appendix. Most faculties require the complete instrument to be appended, so check the handbook for the expected format.

    How do I justify convenience sampling?

    State plainly why probability sampling was not feasible, such as no accessible sampling frame or restricted access to the population. Then acknowledge the effect on generalisability in your limitations. Honest justification is accepted far more readily than a technique described inaccurately.

    What is the most common reason methodology chapters are returned?

    Internal inconsistency. The research question asks about a process while the analysis compares groups, or the sampling technique contradicts the sample size formula. Running the five-point consistency check above before submitting catches nearly all of these.

  • Tajuk Projek Tahun Akhir 2026: 50 Cadangan Mengikut Fakulti

    Tajuk Projek Tahun Akhir 2026: 50 Cadangan Mengikut Fakulti

    Tajuk projek tahun akhir yang baik mengandungi tiga unsur: pemboleh ubah yang dikaji, lokasi atau objek kajian, dan tempoh masanya. Lima puluh cadangan di bawah disusun mengikut pola itu untuk sepuluh fakulti. Gunakan sebagai titik permulaan, kemudian sesuaikan dengan lokasi yang benar-benar boleh anda akses.

    Amaran yang perlu disebut lebih awal: jangan hantar mana-mana tajuk daripada senarai ini tanpa penyesuaian. Tajuk yang tidak disesuaikan dengan lokasi yang boleh anda capai ialah punca penolakan yang paling lazim, dan penyelia berpengalaman mengenalinya dengan serta-merta.

    Ujian kelayakan sebelum menghantar tajuk

    Sebelum membawa tajuk kepada penyelia, jawab empat soalan ini. Jika ada satu sahaja yang anda tidak dapat jawab, tajuk itu belum sedia.

    1. Di mana datanya, dan bolehkah anda mendapatkannya? Tajuk yang memerlukan data dalaman syarikat sedangkan anda tiada akses ke sana akan tersekat di pertengahan. Pastikan akses sebelum, bukan selepas, cadangan diluluskan.
    2. Berapa banyak kajian lepas mengenainya? Sifar bermakna berisiko kerana anda tiada pijakan. Beratus bermakna sukar mencari ruang baharu. Yang ideal berada di antaranya.
    3. Bolehkah ia disiapkan dalam satu semester? Kira ke belakang secara jujur daripada tarikh akhir penghantaran.
    4. Adakah ada pensyarah di fakulti anda yang mahir dalam bidang itu? Tajuk menarik tanpa penyelia yang menguasainya akan berjalan sangat perlahan.
    Meja perbincangan penyelia dengan dokumen cadangan projek
    Bawa tiga tajuk ke perjumpaan pertama dengan penyelia, bukan satu. Ia mempercepat keputusan.

    Pengurusan dan Perniagaan

    1. Pengaruh Kerja Fleksibel dan Beban Tugas terhadap Prestasi Pekerja di [Organisasi] Tahun 2026
    2. Kesan Kualiti Perkhidmatan Digital terhadap Kesetiaan Pelanggan Bank di [Bandar]
    3. Strategi Pemasaran Digital Perusahaan Mikro dan Kecil dalam Menghadapi Persaingan Platform Penghantaran di [Bandar]
    4. Hubungan Kepimpinan Transformasi dengan Keterlibatan Kerja dalam Kalangan Kakitangan [Organisasi]
    5. Faktor yang Mempengaruhi Keputusan Pelaburan Pelabur Muda di [Negeri]

    Perakaunan dan Kewangan

    1. Kesan Keberuntungan, Kecairan dan Leveraj terhadap Nilai Firma Sektor Pembuatan 2021–2025
    2. Hubungan Saiz Firma dan Pemilikan Institusi dengan Kualiti Perolehan
    3. Amalan Perakaunan dalam Kalangan Perusahaan Mikro di [Bandar]
    4. Kesan Pendedahan Maklumat Kelestarian terhadap Prestasi Kewangan Syarikat Tersenarai
    5. Analisis Pengurusan Kewangan Koperasi di [Negeri] bagi Tahun Kewangan 2025

    Pendidikan

    1. Kesan Pembelajaran Berasaskan Projek terhadap Kemahiran Berfikir Kritis Murid Tingkatan [X] di [Sekolah]
    2. Kesediaan Guru Melaksanakan Pengajaran Terbeza di Sekolah Rendah Daerah [Daerah]
    3. Kesan Penggunaan Media Pengajaran Interaktif terhadap Pencapaian Matematik Murid
    4. Strategi Guru Menangani Jurang Kemahiran Membaca Murid Tahap Satu
    5. Sikap Guru terhadap Penggunaan Alat Kecerdasan Buatan oleh Murid Sekolah Menengah

    Psikologi

    1. Hubungan Sokongan Sosial Rakan Sebaya dengan Tekanan Akademik Pelajar Tahun Akhir
    2. Kesan Regulasi Kendiri terhadap Penangguhan Akademik dalam Kalangan Pelajar Menyiapkan Tesis
    3. Hubungan Kualiti Tidur dengan Tumpuan Belajar Pelajar Universiti
    4. Kesejahteraan Psikologi Pekerja yang Bekerja dari Rumah di [Sektor]
    5. Hubungan Perbandingan Sosial di Media Sosial dengan Harga Diri Remaja

    Sains Komputer dan Teknologi Maklumat

    1. Pembangunan Sistem Maklumat [Perkhidmatan] Berasaskan Web untuk [Institusi]
    2. Penggunaan Kaedah Pengelasan untuk Meramal [Objek] Menggunakan Data [Sumber]
    3. Penilaian Kebolehgunaan Antara Muka Aplikasi [Perkhidmatan Awam] Menggunakan Ujian Pengguna
    4. Perbandingan Prestasi Algoritma [A] dan [B] bagi Masalah [Masalah]
    5. Faktor Penerimaan Pengguna terhadap Aplikasi [Perkhidmatan] dalam Kalangan Pengguna di [Bandar]

    Kejuruteraan

    1. Analisis Prestasi Sistem [Komponen] di Bawah Keadaan Beban [Parameter]
    2. Penilaian Kualiti Air Sungai [Sungai] Berdasarkan Data Pemantauan 2021–2025
    3. Kajian Kesesuaian Bahan [Bahan] sebagai Ganti Separa dalam Campuran Konkrit
    4. Analisis Corak Hujan dan Implikasinya terhadap Sistem Saliran di [Kawasan]
    5. Penilaian Kecekapan Tenaga Bangunan [Jenis] di [Institusi]

    Sains Kesihatan dan Kejururawatan

    1. Hubungan Pengetahuan dan Sikap dengan Kepatuhan Pengambilan Ubat Pesakit [Penyakit] di [Fasiliti]
    2. Kesan Pendidikan Kesihatan terhadap Tahap Kebimbangan Pesakit Sebelum Pembedahan
    3. Beban Kerja dan Keletihan Jururawat Syif Malam di [Hospital]
    4. Hubungan Pola Pemakanan dan Aktiviti Fizikal dengan Status Berat Badan Remaja di [Sekolah]
    5. Faktor yang Mempengaruhi Liputan Imunisasi Kanak-kanak di Kawasan [Klinik Kesihatan]

    Undang-undang

    1. Perlindungan Undang-undang terhadap Data Peribadi Pengguna Perkhidmatan Kewangan Digital
    2. Tanggungjawab Undang-undang bagi Penyebaran Maklumat Palsu di Media Sosial
    3. Kedudukan Undang-undang Pekerja Ekonomi Gig Berasaskan Aplikasi
    4. Analisis Keputusan Mahkamah Berkaitan [Isu] dalam Kes [Rujukan Kes]
    5. Isu Undang-undang Hak Cipta bagi Karya yang Dihasilkan dengan Bantuan Kecerdasan Buatan

    Komunikasi dan Media

    1. Analisis Bingkai Laporan Berita mengenai [Isu] dalam Dua Portal Berita Dalam Talian
    2. Kesan Pendedahan Kandungan Promosi Media Sosial terhadap Niat Membeli Golongan Muda
    3. Strategi Komunikasi Agensi Kerajaan dalam Menyampaikan Maklumat [Program] di [Negeri]
    4. Representasi [Kumpulan] dalam Iklan Perkhidmatan Awam di Malaysia
    5. Keberkesanan Komunikasi Krisis [Organisasi] melalui Saluran Media Sosial

    Alam Sekitar dan Pertanian

    1. Analisis Kebolehlaksanaan Ekonomi Usaha Tani [Komoditi] di [Daerah]
    2. Saluran Pemasaran dan Margin Pemasaran [Komoditi] di [Negeri]
    3. Kesan Penerimaan Teknologi Pertanian terhadap Produktiviti Petani [Komoditi]
    4. Analisis Kualiti Udara di Kawasan [Kawasan] Berdasarkan Data Pemantauan 2021–2025
    5. Strategi Pengurusan Sisa Pepejal di [Majlis Tempatan] dan Cabaran Pelaksanaannya

    Cara menyesuaikan tajuk daripada senarai ini

    Setiap kurungan siku dalam senarai di atas wajib anda isi. Isian itulah yang menjadikan tajuk itu milik anda dan sekali gus menentukan sama ada kajian itu boleh dilaksanakan.

    1. Tetapkan lokasi dahulu, bukan tajuk. Mulakan daripada tempat yang benar-benar boleh anda capai: tempat latihan industri, tempat kerja keluarga, sekolah lama anda, atau kawasan tempat anda tinggal. Akses ialah aset paling berharga yang anda ada.
    2. Semak ketersediaan kajian lepas. Cari pemboleh ubah anda dalam pangkalan data jurnal untuk melihat sama ada kajian serupa sudah wujud.
    3. Sempitkan sehingga boleh dilaksanakan. “Kesan Media Sosial terhadap Remaja” terlalu luas. “Hubungan Tempoh Penggunaan Media Sosial dengan Kualiti Tidur Murid Tingkatan Empat di [Sekolah]” boleh dilaksanakan.
    4. Sediakan dua tajuk simpanan. Bawa tiga tajuk ke perjumpaan pertama, bukan satu.

    Kesilapan lazim semasa memilih tajuk

    • Memilih tajuk kerana ia kedengaran hebat. Tajuk yang bunyinya canggih tetapi datanya tidak wujud akan menjadi beban selama satu semester penuh.
    • Menetapkan terlalu banyak pemboleh ubah. Empat atau lima pemboleh ubah bebas dalam satu projek peringkat ijazah pertama biasanya terlalu berat. Dua atau tiga sudah memadai.
    • Menyalin tajuk daripada kajian luar negara tanpa menyesuaikan konteks. Model yang sah di negara lain mungkin tidak relevan dengan struktur institusi atau pasaran di Malaysia.
    • Mengabaikan keperluan kebenaran. Kajian yang melibatkan sekolah, hospital atau agensi kerajaan memerlukan kelulusan rasmi yang mengambil masa. Kira tempoh ini dalam jadual anda.
    • Menunggu tajuk yang sempurna. Tajuk yang baik dan boleh dimulakan hari ini lebih bernilai daripada tajuk sempurna yang masih dicari pada minggu keenam.

    Menguji tajuk dengan pernyataan masalah

    Ujian terakhir yang paling menentukan: cuba tulis persoalan kajian daripada tajuk anda. Jika anda sukar merumuskannya menjadi soalan yang jelas, tajuk itu belum matang.

    Kata tanya yang muncul juga terus menentukan reka bentuk kajian anda. Tajuk yang bertanya “sejauh mana kesan” menuntut pendekatan kuantitatif, manakala yang bertanya “bagaimana proses” menuntut pendekatan kualitatif.

    Bagi tajuk yang menggunakan data rasmi seperti penyata kewangan atau data alam sekitar, semak dahulu ketersediaannya melalui sumber data sekunder untuk tesis di Malaysia. Tajuk yang datanya tidak wujud akan tersekat di bab metodologi. Untuk konteks perangkaan pendidikan tinggi, rujuk data pendidikan tinggi Malaysia 2026.

    Daripada tajuk kepada cadangan penyelidikan

    Tajuk yang diluluskan hanyalah permulaan. Kerja seterusnya ialah menukarnya menjadi cadangan penyelidikan: latar belakang yang menjelaskan mengapa masalah itu penting, pernyataan masalah yang tajam, dan kerangka teori yang menyokong jangkaan anda. Di sinilah ramai pelajar tersekat berminggu-minggu, bukan kerana kekurangan idea, tetapi kerana sukar menyusunnya secara teratur.

    Tesify membantu anda mengembangkan tajuk yang telah diluluskan menjadi rangka cadangan yang lengkap, bahagian demi bahagian, dengan anda kekal sebagai penulis dan bertanggungjawab atas kandungannya. Lebih 9,000 pelajar telah menggunakannya untuk menyiapkan lebih 15,000 bab, dan 100% tulisan kekal milik anda.

    Kembangkan tajuk anda menjadi cadangan di Tesify

    Soalan lazim

    Bolehkah saya menggunakan tajuk yang hampir sama dengan projek terdahulu?

    Boleh, asalkan lokasi, tempoh atau pemboleh ubahnya berbeza. Inilah bentuk kebaharuan yang lazim diterima di peringkat ijazah pertama: menerapkan model sedia ada pada objek yang belum pernah dikaji. Yang tidak dibenarkan ialah menyalin kandungannya.

    Berapa panjang tajuk yang sesuai?

    Kebanyakan panduan fakulti mencadangkan sekitar 12 hingga 20 patah perkataan, cukup untuk memuatkan pemboleh ubah, objek dan tempoh tanpa menjadi ayat panjang. Semak panduan fakulti anda kerana sesetengahnya menetapkan had dengan tegas.

    Bolehkah tajuk diubah selepas cadangan diluluskan?

    Umumnya boleh, dan perubahan kecil memang kerap berlaku selepas data dikumpul. Perubahan besar biasanya memerlukan kelulusan penyelia dan kadangkala proses pentadbiran tersendiri. Tanya prosedurnya di pejabat akademik seawal mungkin.

    Bagaimana jika tajuk saya ditolak berulang kali?

    Tanya sebab penolakan secara khusus, bukan sekadar meminta tajuk baharu. Penolakan berulang biasanya berpunca daripada satu daripada tiga perkara: data tidak boleh dicapai, tajuk di luar kepakaran penyelia, atau skop terlalu luas. Ketiga-tiganya memerlukan penyelesaian berbeza.

    Adakah tajuk berkaitan kecerdasan buatan masih sesuai untuk 2026?

    Masih, tetapi elakkan tajuk yang terlalu umum kerana sudah banyak dikaji. Yang masih terbuka ialah penerapannya dalam konteks Malaysia yang khusus, contohnya sikap guru di sesuatu daerah, penggunaannya dalam perkhidmatan tertentu, atau isu perundangan yang belum terjawab.

    Perlukah tajuk menyatakan tahun?

    Tidak semestinya, tetapi menyatakan tempoh amat digalakkan jika anda menggunakan data sekunder siri masa atau mengkaji peristiwa yang terikat masa. Bagi kajian tinjauan, tempoh biasanya memadai dinyatakan dalam bab metodologi.

    Bagaimana jika tiada kajian lepas mengenai tajuk saya?

    Semak semula kata kunci anda dahulu, kerana puncanya hampir selalu carian yang terlalu sempit. Jika selepas mencuba pelbagai istilah tetap tiada, pertimbangkan untuk menaikkan satu aras keumumannya. Tajuk tanpa sebarang pijakan literatur berisiko tinggi.

    Adakah tajuk yang hebat menjamin markah yang tinggi?

    Tidak. Tajuk menentukan sama ada kajian boleh dilaksanakan, manakala markah ditentukan oleh ketepatan kaedah dan kedalaman perbincangan. Tajuk sederhana yang dikendalikan dengan kemas hampir selalu dinilai lebih baik daripada tajuk bercita-cita tinggi yang siap separuh jalan.

    Bilakah masa terbaik mula memikirkan tajuk?

    Sebaiknya satu semester sebelum kursus projek bermula, terutama jika kajian anda memerlukan kebenaran daripada organisasi atau kelulusan etika. Tempoh mendapatkan kebenaran kerap dipandang ringan dan menjadi punca kelewatan yang paling lazim.

    Perlukah saya memilih tajuk mengikut minat atau mengikut kemudahan data?

    Kedua-duanya penting, tetapi ketersediaan data lebih menentukan sama ada anda akan tamat tepat masa. Cari titik pertemuan: satu topik yang anda benar-benar berminat dan datanya boleh anda capai. Minat semata-mata tanpa data akan menyeksakan pada bulan terakhir.