
| Source | Best for | Data type | Access | Weakness |
|---|---|---|---|---|
| DOE APIMS / RQIMS / MQIMS | National air and water quality time series | Air Pollutant Index, river and marine water quality index readings | Public dashboards | Station-level detail and historical export vary by portal |
| DOE EDL & EKAS | Project-level environmental impact documents | EIA executive summaries, project status, registered environmental auditors | Public search, document-by-document | Full EIA reports are not always downloadable; summaries only for many projects |
| DOSM environment-related statistics | National aggregated indicators over time | Selected environment and natural resource indicators alongside other official statistics | Public, via DOSM’s official statistics releases | Coverage of environment-specific indicators is thinner than DOE’s operational data |
| Satellite and remote-sensing data (Earth Engine, NASA Earthdata, Copernicus) | Land cover, deforestation, flood extent, air quality proxies over time | Free global satellite imagery and derived datasets | Free registration, requires processing skill | Needs GIS or coding ability to extract a usable figure; not Malaysia-specific out of the box |
| State environment and drainage departments | Local, site-specific readings not aggregated nationally | Varies by state and agency | Varies; often by written request | No single portal; access and response time depend on the specific state office |
Recommended default: for most Malaysian environmental science FYPs and dissertations, start with the Department of Environment Malaysia’s own monitoring systems — they are the national regulator’s own operational data, which examiners recognise as authoritative, and they cover the two pollutant families (air, water) that most undergraduate projects study.
Environmental science FYPs and dissertations in Malaysia stall most often at the same point: the student has a research question but no idea which of several government systems actually holds the figures they need, and searches burn weeks before the methodology chapter can even start. This comparison works through what each source actually contains, based on what is published on the source’s own site, so you can pick the right one for your specific variable before you request access or start extracting data.
What does the Department of Environment’s monitoring data actually cover?
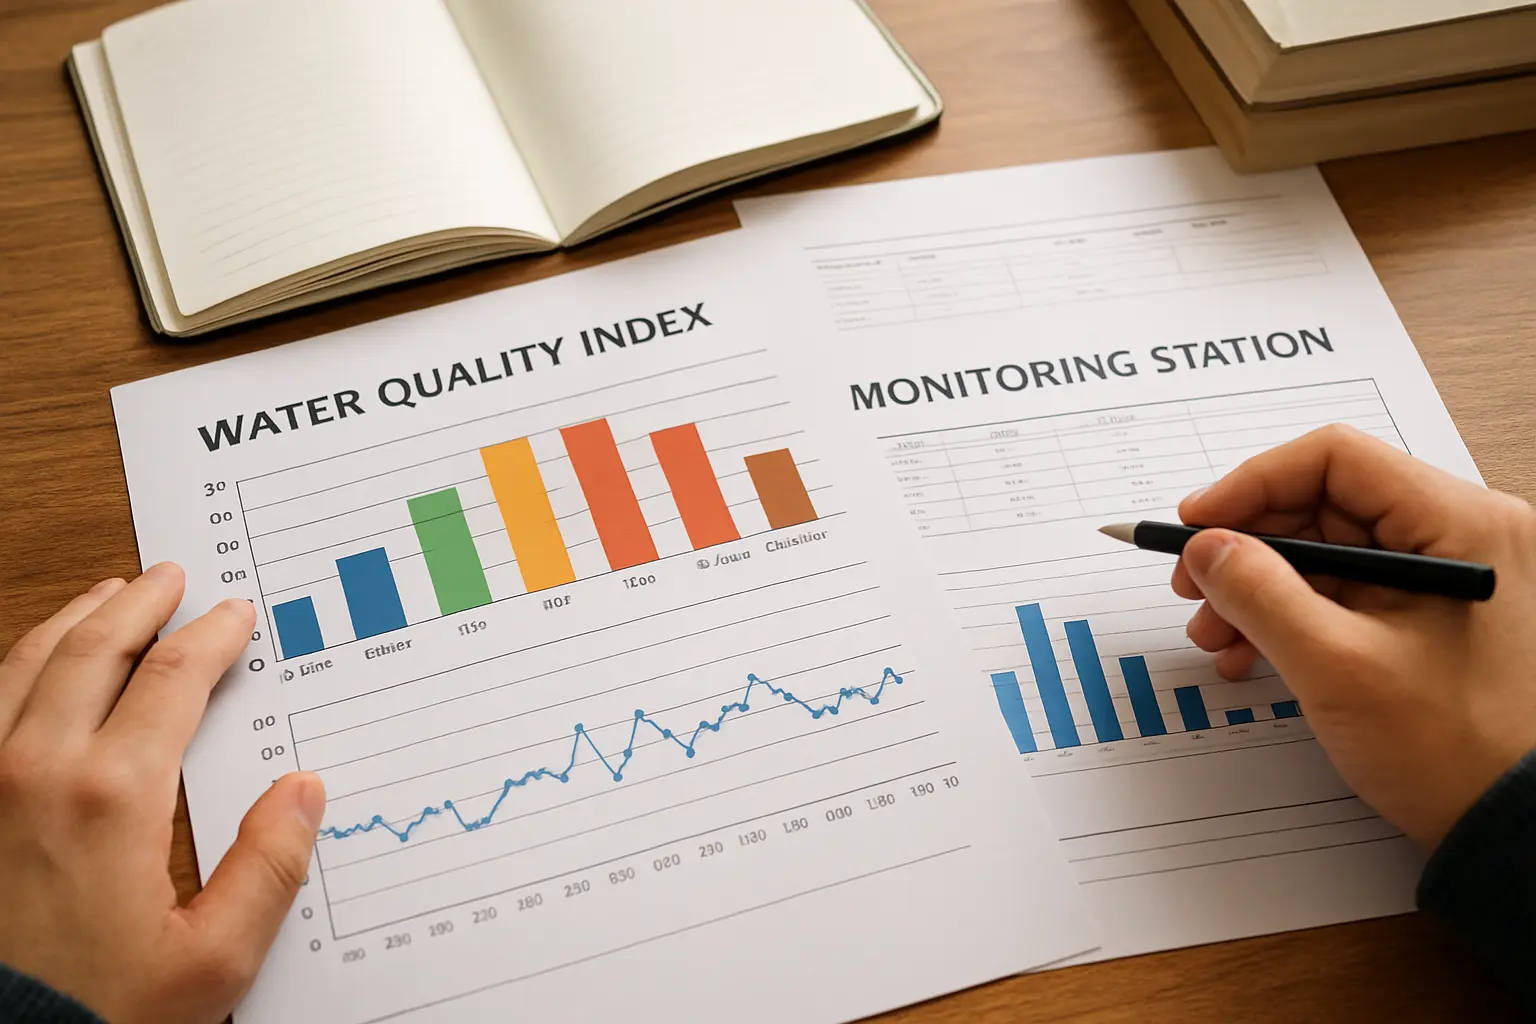
The Department of Environment (DOE) Malaysia runs several named operational systems, each covering a specific environmental domain. The Air Pollutant Index Management System (APIMS) tracks the national Air Pollutant Index, the standard measure Malaysian air-quality studies cite. The River Water Quality Index Management System (RQIMS) and the Marine Water Quality Index Management System (MQIMS) track freshwater river and coastal marine water quality respectively, each against DOE’s own water quality index. For students studying industrial environmental compliance rather than ambient monitoring, DOE also operates CEMS (continuous emission monitoring for industrial facilities), MyEHS and eSWIS (scheduled waste and hazardous material reporting), and a public complaints channel (e-Aduan and SISPAA) that can itself be a data source for a study of environmental complaint patterns by area or issue type.
What do the EDL and EKAS systems cover, and how do they differ from the monitoring dashboards?
Where APIMS, RQIMS and MQIMS report ongoing ambient monitoring, DOE’s Enviro Digital Library (EDL) and EKAS system serve a different purpose: EDL holds environmental documents including executive summaries of Environmental Impact Assessment (EIA) reports, and EKAS tracks EIA project status alongside the registry of registered environmental consultants and auditors. For a thesis studying a specific development’s environmental approval process, a comparison of EIA outcomes across projects, or the environmental consultancy sector itself, EDL and EKAS are the relevant sources rather than the ambient monitoring dashboards — a common mistake is searching APIMS for project-specific data it was never designed to hold.
Where do official aggregated statistics fit in, and what are their limits?
The Department of Statistics Malaysia (DOSM) publishes selected environment and natural-resource indicators as part of its wider official statistics output, useful when your research question needs a national-level headline figure to frame your introduction or literature review rather than the granular, station-level data a methodology chapter needs. Our guide to finding papers for a literature review covers how to combine an aggregated statistic like this with the academic literature that interprets it. Treat a DOSM aggregate as context, not as your primary dataset, unless your specific research question is genuinely about the national indicator itself rather than a local or site-specific pattern.
When should I use satellite and remote-sensing data instead?
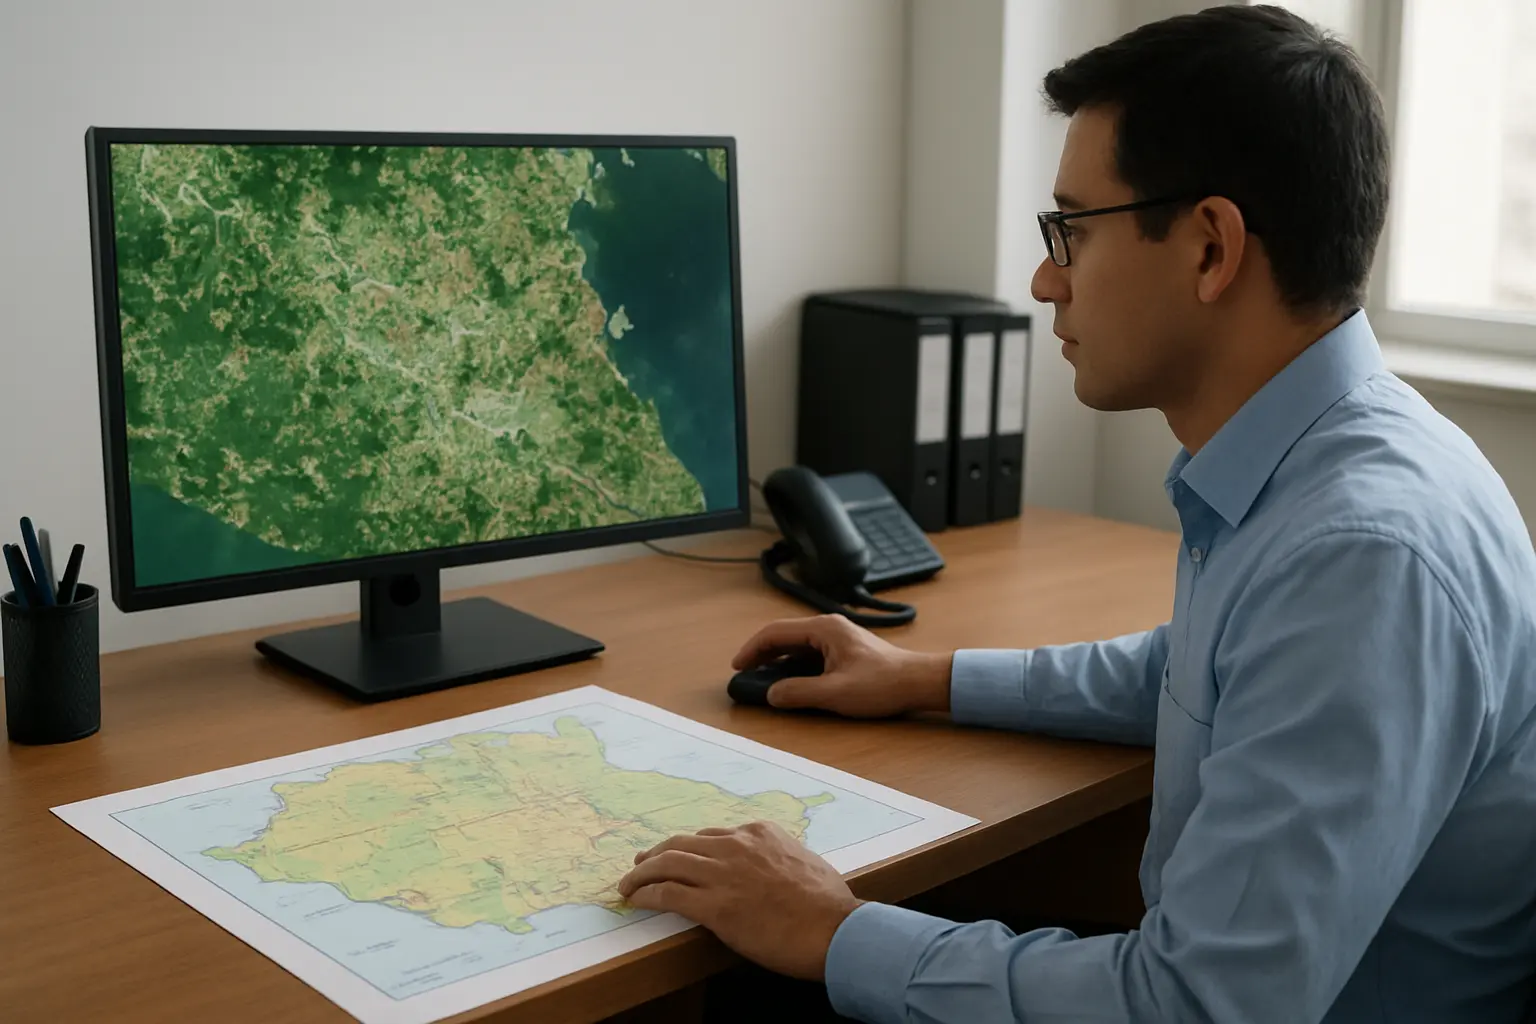
For research questions about land cover change, deforestation, urban heat, flood extent or vegetation health over time, no Malaysian government portal offers a ready-made download at the resolution most FYPs need — this is where free global platforms fill the gap. Google Earth Engine and NASA’s Earthdata catalogue both provide free access to satellite imagery and several pre-processed derived products (land cover classifications, vegetation indices, flood-mapping layers) covering Malaysia at no cost, though extracting a usable figure from either requires basic GIS or scripting ability, which is worth confirming with your supervisor before committing to this route for an undergraduate timeline. The European Union’s Copernicus programme offers a similar free catalogue with strong coverage of Southeast Asia. These sources suit a spatial-analysis thesis far better than a table of index readings ever could, but budget real time to learn the processing workflow if you have not used one before.
How do I combine official data with a primary survey or field measurement?
Many strong Malaysian environmental science FYPs pair a secondary data source with primary data the student collects directly — a household survey of perceived flood risk alongside DID or DOE hydrological readings, or a set of field water-quality samples validated against the nearest RQIMS station. If your design adds a survey component, our guide to the best survey tools for FYP data collection covers the platforms Malaysian students use to run it, and our guide to how many respondents you need covers the sample-size reasoning for the primary-data half of a mixed design like this. State clearly in your methodology which findings come from official secondary data and which from your own collection, since examiners assess the two against different standards of rigour.
How should I report and analyse data once you have extracted it?
Once extracted, most DOE index readings and DOSM indicators are continuous time-series or ordinal index values, which shapes the analysis you can run — our guide to which statistical test to use for FYP data covers matching a test to a data type like this, and our guide to the best statistical software for a Malaysian thesis covers the tools most environmental science students use to run trend analysis or compare readings across stations or periods. Document the exact extraction date and method for every figure you pull from a government dashboard, since these systems update and occasionally revise historical figures, and an examiner who cannot see when you accessed the data cannot judge whether a discrepancy with a more recent figure reflects an error or simply an update.
How do I request access when a system is not fully public?
Where a DOE system’s public interface does not expose the granularity your study needs — station-level raw readings rather than an index summary, for instance — the standard route is a written data request to the relevant DOE state office or headquarters unit, copied to your supervisor, stating precisely what you need and for what academic purpose. Build in several weeks for a response when your project timeline depends on this, and have a fallback plan (a coarser but public dataset, or a different research question scoped to what is publicly available) in case the request does not clear in time.
Get your data-sources section drafted once you have chosen
Once you know which source holds your variable, describing it correctly in your methodology chapter still takes care — the exact system name, what it measures, and its access route all need to be stated precisely for an examiner to trust the data’s provenance. Tesify helps you draft that section: describe the source you are using and what you extracted from it, and it returns a data-source description in the register Malaysian environmental science examiners expect, ready for you to check against the actual data you collected.
Draft your environmental science data sources section with Tesify
Frequently asked questions
Do I need permission to use DOE’s public monitoring dashboards in my FYP?
Using publicly displayed index readings for academic analysis generally does not require special permission, but always cite the source system and the date you accessed it, and check your faculty’s own policy on using government open data.
Which DOE system should I use for a study of haze or transboundary air pollution?
APIMS for the Malaysian Air Pollutant Index itself; for the regional hotspot picture during haze episodes, the ASEAN Specialised Meteorological Centre (ASMC) provides the hotspot and smoke-plume data DOE’s own site references.
Can I combine DOE data with a survey I conduct myself?
Yes, and this is a common and strong design: official monitoring data establishes the environmental condition, while your own survey measures community awareness, perception or behaviour in response to it.
Is OpenDOSM the same as the Department of Statistics Malaysia’s main data catalogue?
OpenDOSM is DOSM’s open-data portal; coverage varies by topic and some searches return no entries even where DOSM publishes the figure elsewhere in a report, so check both the portal and DOSM’s published reports before concluding a figure does not exist.
How far back does DOE’s monitoring data typically go?
This varies by station and system; state the specific date range you were able to access in your methodology chapter rather than assuming a fixed historical depth, since coverage is not uniform across all monitoring stations.
Do I need GIS software to use satellite data, or can I use a simpler tool?
Google Earth Engine’s code editor is the standard entry point and is free, but some pre-processed layers are also downloadable as image files usable in simpler mapping software; discuss the trade-off with your supervisor based on your project’s timeline and your own technical background.
What if the DOE system I need shows no data for my specific district or period?
State the gap explicitly in your methodology and limitations sections rather than substituting a nearby station’s data without saying so, and consider whether a coarser geographic or temporal scope would still answer a meaningful version of your research question.
Are state-level environment departments worth contacting for an undergraduate FYP?
Sometimes, for genuinely local data unavailable nationally, but build extra time into your schedule since response times and the format of what you receive vary by state office, and always have a public-data fallback plan.
Can I cite a DOE dashboard reading directly, or do I need a published report?
A dashboard reading is citable as a source with an access date, similar to any other web-based dataset, but where DOE also publishes an annual report with the same figures, citing the report alongside the dashboard strengthens your reference.
Should my literature review or my data sources section come first in Chapter 3?
Data sources and access belong in the methodology chapter alongside your research design, not the literature review, which stays focused on prior academic studies rather than where you obtained your own data.